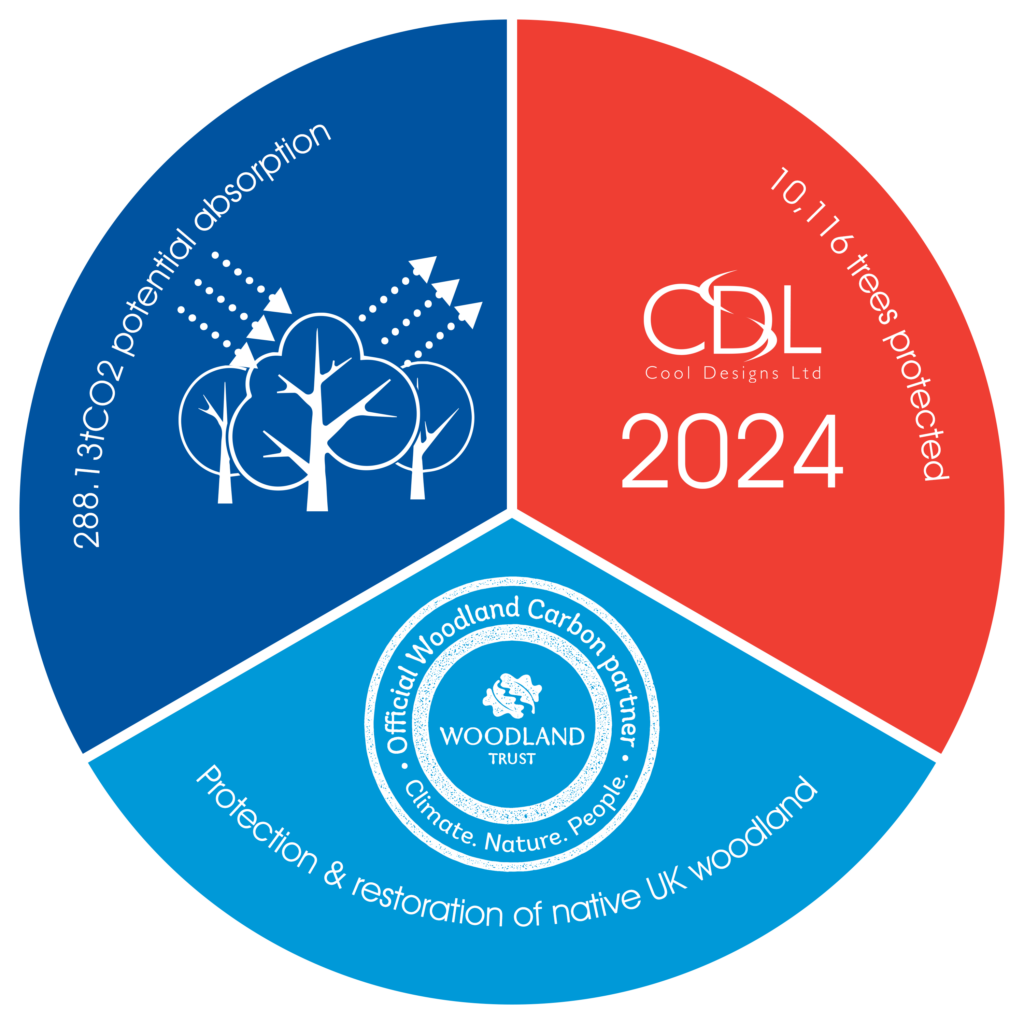
Cool Designs donating to the protection and restoration of native UK trees during 2024.
There has been a significant reduction 39% reduction tCO2e per £m from 2019 to 2023, an indication that Cool Designs are making a concerted effort to ensure the business is driven in a sustainable direction.
Similarly, using the kgCO2e per floor area intensity metric, there is a 21% reduction in the energy used per floor area from 2019 to 2023. This is a significant reduction in the amount of energy used per floor area and indication that the business operations are driven to ensure less energy is used.
CDL working with Delta Simons for the FY2023 Carbon Footprint Assessment. It is our aim to mitigate our Scope 1,2 & 3 carbon emissions, through the purchase of carbon offsets / forestry and habitat conservation projects. The carbon footprint assesses the impact from utility consumption, third party courier services, business travel and commuting for the CDL. Capital goods (e.g., irregular larger purchases such as IT equipment, furniture, vehicles) are excluded from the carbon footprint, as these are not representative of day-to-day operations.
We have been reporting our carbon footprint since the 2011 financial reporting year with the carbon neutral company.
Operation Scopes
GHG Emissions are categorised into Scopes:
Scope 2 – Indirect emissions resulting from the consumption of purchased electricity that has been generated off-site and supplied by the national grid. It is also mandatory to report Scope 2 emissions.
Scope 3 – Indirect emissions associated with the consequences of the activities of the organisation but controlled by another entity outside of the corporate structure. Scope 3 emissions are voluntarily reported by organisations who wish to assess the wider impact of their business operations.
GHG emissions associated with Cool Designs operations during the 2023 reporting year have been calculated. Table 1 summarises total operational emissions by Scope.
SCOPE 1 result 87.66tCO2e
SCOPE 2 result 13.00tCO2e
SCOPE 3 result 187.47tCO2e
Total Result – 288.13tCO2e
This shows that total emissions for the period 1st January 2023 – 31st December 2023 totalling 288.13 tCO2e. Scope 1 emissions (fleet vehicles) accounts for 30% of total carbon emissions. Scope 2 emissions, associated with purchased electricity and on-site renewables, in the form of solar PV for the Gateshead office, are responsible 5% of total emissions. The remaining 65% is attributable to indirect Scope 3 emissions from category 1: purchased goods and services (paper and water), category 3: fuel and energy related activities (electricity and transportation)
category 4: waste generated in operations, category 6: business travel (rail, taxi’s, flights, hotel stays, personal vehicle use and homeworking), category 7: employee commuting, category 8: downstream transport and distribution (3rd party couriers).
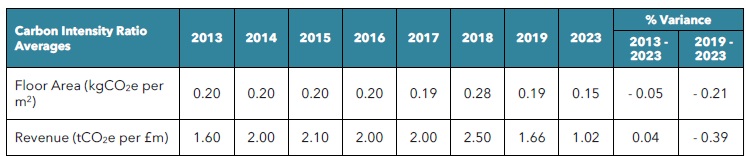
Carbon intensity ratios have been established to assess the normalised carbon performance of operations, based on floor area, employee headcount and revenue. These metrics allow for the business to compare future performance when factoring in growth or changes in business operations on a like for like basis
• Gateshead Head Office, South Shore Road, NE8 3AE – 1,300 m2
• Warrington Office, 16/1 Cranford Court, Hardwick Grance, Warrington, WA1 4RX – 557.4 m2
• Glasgow sub-office Unit 3, Glenburn Road, East Kilbride, Glasgow, G74 5BA – 70 m2
Performance has been assessed using an intensity ratio of tCO2e per £1,000,000 revenue.
A summary of carbon intensity metrics, provided from previous reporting, have been provided from 2013 to 2023. Intensity metrics previously used were kgCO2e per m2 and tCO2e per £m revenue.
As demonstrated in the table above, there has been a significant reduction 39% reduction tCO2e per £m from 2019 to 2023, an indication that Cool Designs are making a concerted effort to ensure the business is driven in a sustainable direction.
Similarly, using the kgCO2e per floor area intensity metric, there is a 21% reduction in the energy used per floor area from 2019 to 2023. This is a significant reduction in the amount of energy used per floor area and indication that the business operations are driven to ensure less energy is used
Carbon Offset.
With the figure calculation, we then turn to the Woodland Trust. They offer a donation towards the protection and restoration of native UK trees and the conservation and protection of wildlife and nature within. Their calculation is that to offset the amount of carbon, we need to use 10,116 trees, so our donation towards them in based on that.
Cool Designs will continue to aim for responsible growth which has always been one of our key aims. As the business pushes forward, it does so while making a conscious effort to reduce its carbon intensities.